Decompiling Nvidia shaders, and optimizing

Nvidia instructions for Shadertoy New shader, envydis output
About decompiling Nvidia OpenGL and Vulkan fragment shaders.
Main tool to make it work - nvcachetools made by Theron Tarigo.
This is my tutorial/note for Linux, but it works very similar way on Windows, look nvcachetools github page to see more info about using it on other OS.
Look example-usage and shader-optimization at the end.
Update 2024:
Nvidia changed binary format of Vulkan shaders — check this for more info.
nvcachetools works with new change, but check link above if it does not.
Tested on Nvidia 4060 on 550 Nvidia drivers.
nvcachetools — It extracts shaders from specificied cache toc file, normally in
$HOME/.nv/GLCache/Nvidia driver puts shaders here regardless of API, both Vulkan and OpenGL.
Shader can be decompiled with nvdisasm ( - binary option) or with this open-source disassembler envytools if you have Maxwell or one of the older GPU it supports.
Detailed instruction and example use cases below.
Note — default cache folder ~/.nv/GLCache may not exist so cache files not saved, create this folder manualy.
Or export __GL_SHADER_DISK_CACHE_PATH=<path>
Tools
- Build nvcachetools.
- Build envytools.
Non opensource alternative, proprietary software made by Nvidia — install CUDA or download cuda-nvdisasm and extract nvdisasm file.
Short instruction
./nvcachedec nv_bin/*.toc objs./nvucdump objs/object00000.nvuc sections
orobject00001.nvucor other number
Look Advanced usage — File names below../envydis -i -mgm107 sections/section4_0001.bin
or/usr/local/cuda/bin/nvdisasm --binary SM89 objs/object00000.nvuc

nvdisasm output for Shadertoy New shader for SM50 — Maxwell architecture Nvidia 750
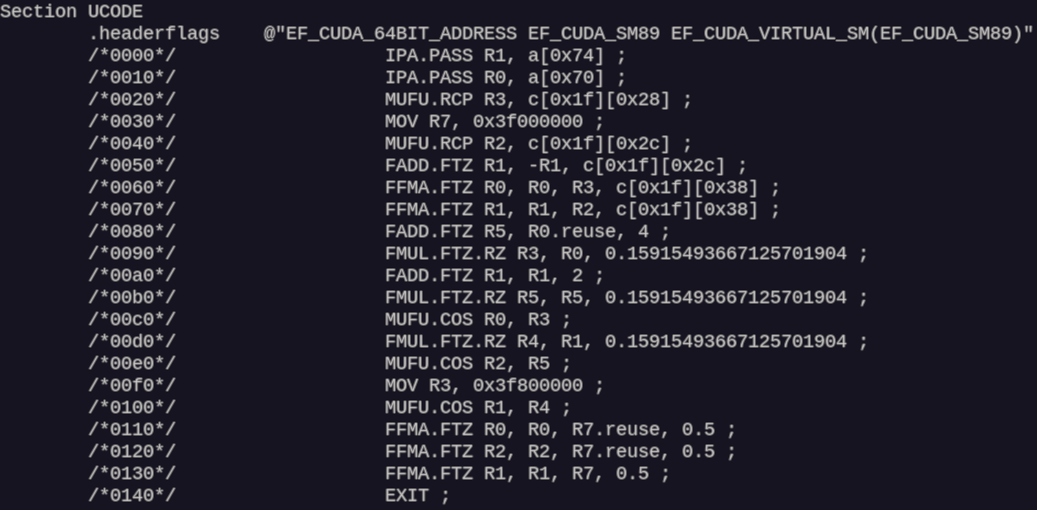
nvdisasm output for Shadertoy New shader for SM89 — Ada Lovelace architecture Nvidia 4060
Instruction
Get compiled shaders from shader cache.
Default location for shader cache: ~/.nv/GLCache
For example — delete everything from “default shader cache” and run your OpenGL or Vulkan application.
If there appears a new folder — this is your compiled shaders.
Applications like Google Chrome use custom location of cache and encrypt it, so it is unusable. Use minimal launchers.
I have only Vulkan launcher — Vulkan-shadertoy-launcher. (for OpenGL you have to look for something minimal)
Files you need is *.bin and *.toc files with same name.
Every unique name of file is all shaders for this application.

Example of single application compiled shaders, after launching this app.
Copy *.bin and *.toc files to a new folder nv_bin folder location at nvcachedec file, just to have result from this single application.
And use nvcachedecto decompile.
Then call nvucdump to extract sections.
Then envydis with parameters, parameters can be found on envydis and envyas documentation page.
Or usenvdisasm options can be found on nvidia docs portal.
Advanced usage
Instruction Set Reference:
- official Nvidia docs link
- envytools documentation:
nVidia hardware documentation — Fermi or Maxwell sections
falcon microprocessor section has more information than others
To calculate number of instructions:
From nvdisasm output.
Visual result of this command — on screenshots below with statistic number of instructions per shader.
/usr/local/cuda-11.8/bin/nvdisasm --print-code --binary SM87 objs/object00000.nvuc | sed '1d' | sed -e 's/@[!|A-Za-z0-9]* / /g' | perl -p0 -e 's#/\*.*?\*/##sg' | sed "s/^[{|}| \t]*//" | sed 's/\s.*$//' | sort | uniq -c
File names to shader names
In case of using my Vulkan-shadertoy-launcher
File names for command ./nvucdump objs/object<NUMBERS>.nvuc sections
Or/and for nvdisasm command
Only when code in each shader is unique:
object00000.nvucisshaders/shadertoy/buf0.glslobject00001.nvucisshaders/src/buf.vertobject00002.nvucisshaders/shadertoy/buf1.glslobject00003.nvucisshaders/shadertoy/buf2.glslobject00004.nvucisshaders/shadertoy/buf3.glslobject00005.nvucisshaders/shadertoy/main_image.glslobject00006.nvucisshaders/src/main.vert
But when shader code is the same — shaders will be compiled into a single *.nvuc file.
For example, in download vulkan-shadertoy-launcher_linux.zip used this shadertoy shader.
Every Buffer shader and Image shader in this Shadertoy is unique — file order will follow my listed order above.*
*Except two Vertex shaders buf.vert and main.vert — they will both be in the object00001.nvuc file.
And for empty_template_shadertoy.zip that use only “New Shadertoy shader” in Image shader.
Shader code in buf0-3.glsl and Vertex shaders is same.
This why it will be just 3 *.nvucfiles, look screenshot:
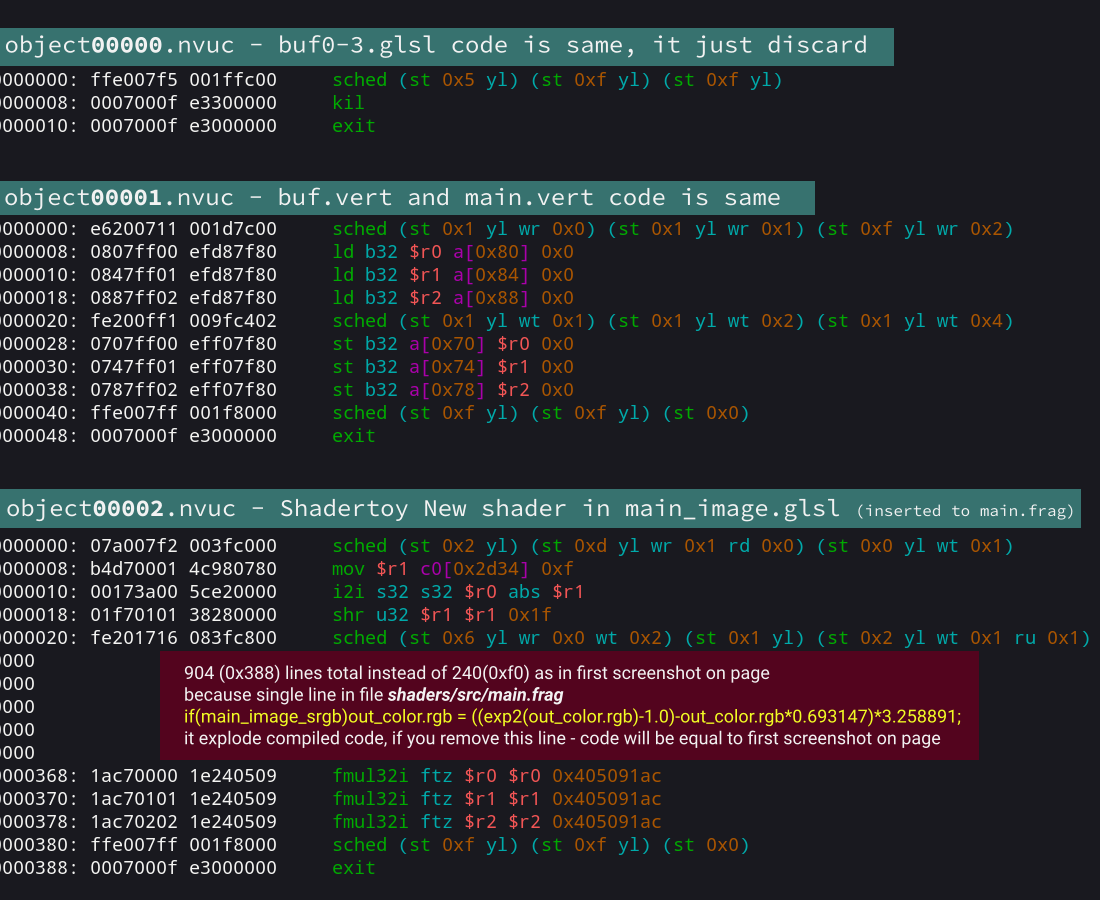
3 decompiled *.nvuc files from empty-template where 4 buffers is just discard, Vertex shader, and image shader is simple New Shader code.
I’m not sure why file names like this. (no idea)
in OpenGL file name order depends on application, and sometimes there are huge gaps in names.
I saw — objs/object00016.nvuc was my first fragment shader, and then objs/object00019.nvuc is second fragment shader, when files 00017-18 not exist, and many similar “gaps” in file names.
Example usage
To see source of major slowdown in shaders:
Major slowdown in shader can come from STL — Store to Local Memory instruction, this mostly used by large arrays in shaders, and/or when arrays copy itself as argument.
And decompiling compiled binary shader, you can see the number of STL calls in compiled code:

Original vs optimized shader
This test shader from screenshot — Shadertoy link STL slowdown.
This bug/slowdown works only on Nvidia in OpenGL.
STL optimization in linked above shader made by Theron Tarigo.
Comparing same GLSL-code shader compiled in OpenGL and Vulkan:
In Nvidia case — OpenGL shader compiler in Nvidia driver can be much worse than shader compiler for Vulkan in driver. Nvidia has a lot of OpenGL only bugs, my list of bugs list some OpenGL only bugs.
Shader from screenshot above (with STL slowdown) works perfectly fine and same fast (as its optimized version) on Nvidia in Vulkan, so — let’s see compiled code of this same shader in Vulkan:

Comparing two shaders compiled in Vulkan and OpenGL
This test shader from screenshot — Shadertoy link STL slowdown.
It’s clear that only OpenGL not optimized shader use STL.
Vulkan code almost same for both shaders, maybe because glslangValidator optimize shader code, so optimization of not-optimized shader happened on glslangValidator side.
Compiled code of optimized version of shader in Vulkan and OpenGL is different.
STL is Always bad! (smaller arrays and less array read/write is always better)
But STL not always bad! (not always the main source of slowdown)
Update 2024 - STL is always bad, but only on Nvidia.
I tested stl-slowdown shader on Nvidia 4060 RTX - and it show 2fps on STL side.
Remember that if you have huge-shader with lots of branches and use arrays — because in shader everything unrolled you can have thousands of STL as result, but shader will work very fast.
Example of shader like this and to test—my shader GLSL Auto Tetris.
On screenshots below — shader from BufA when AI works(#define no_AI not set)
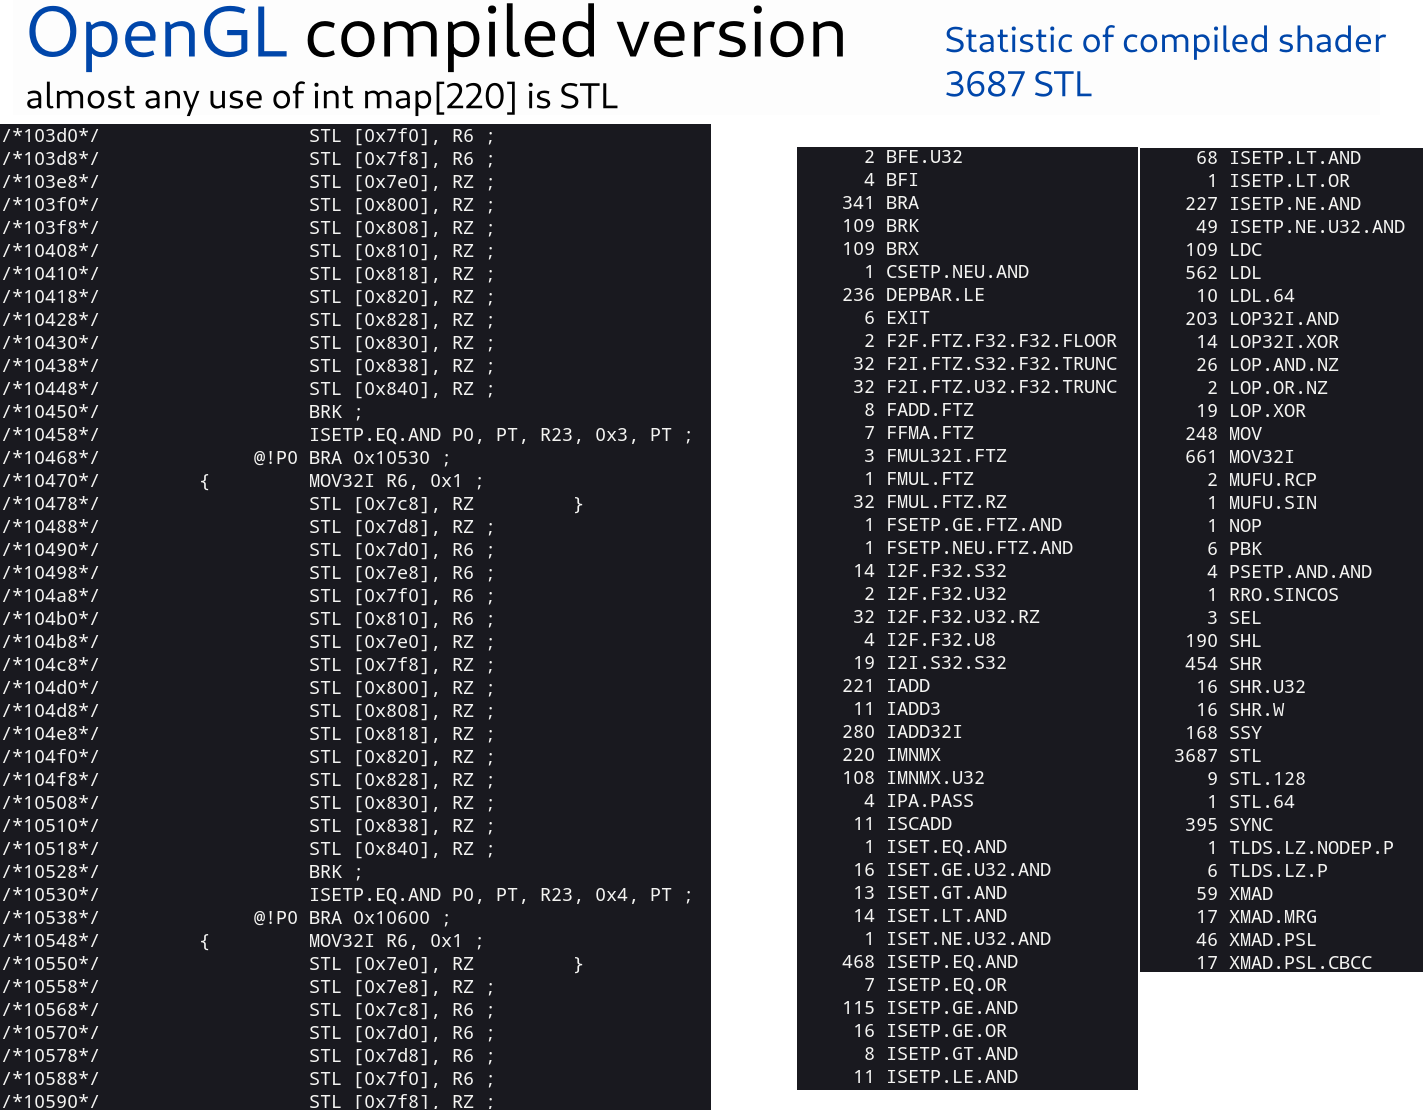
OpenGL statistic of shader in BufA
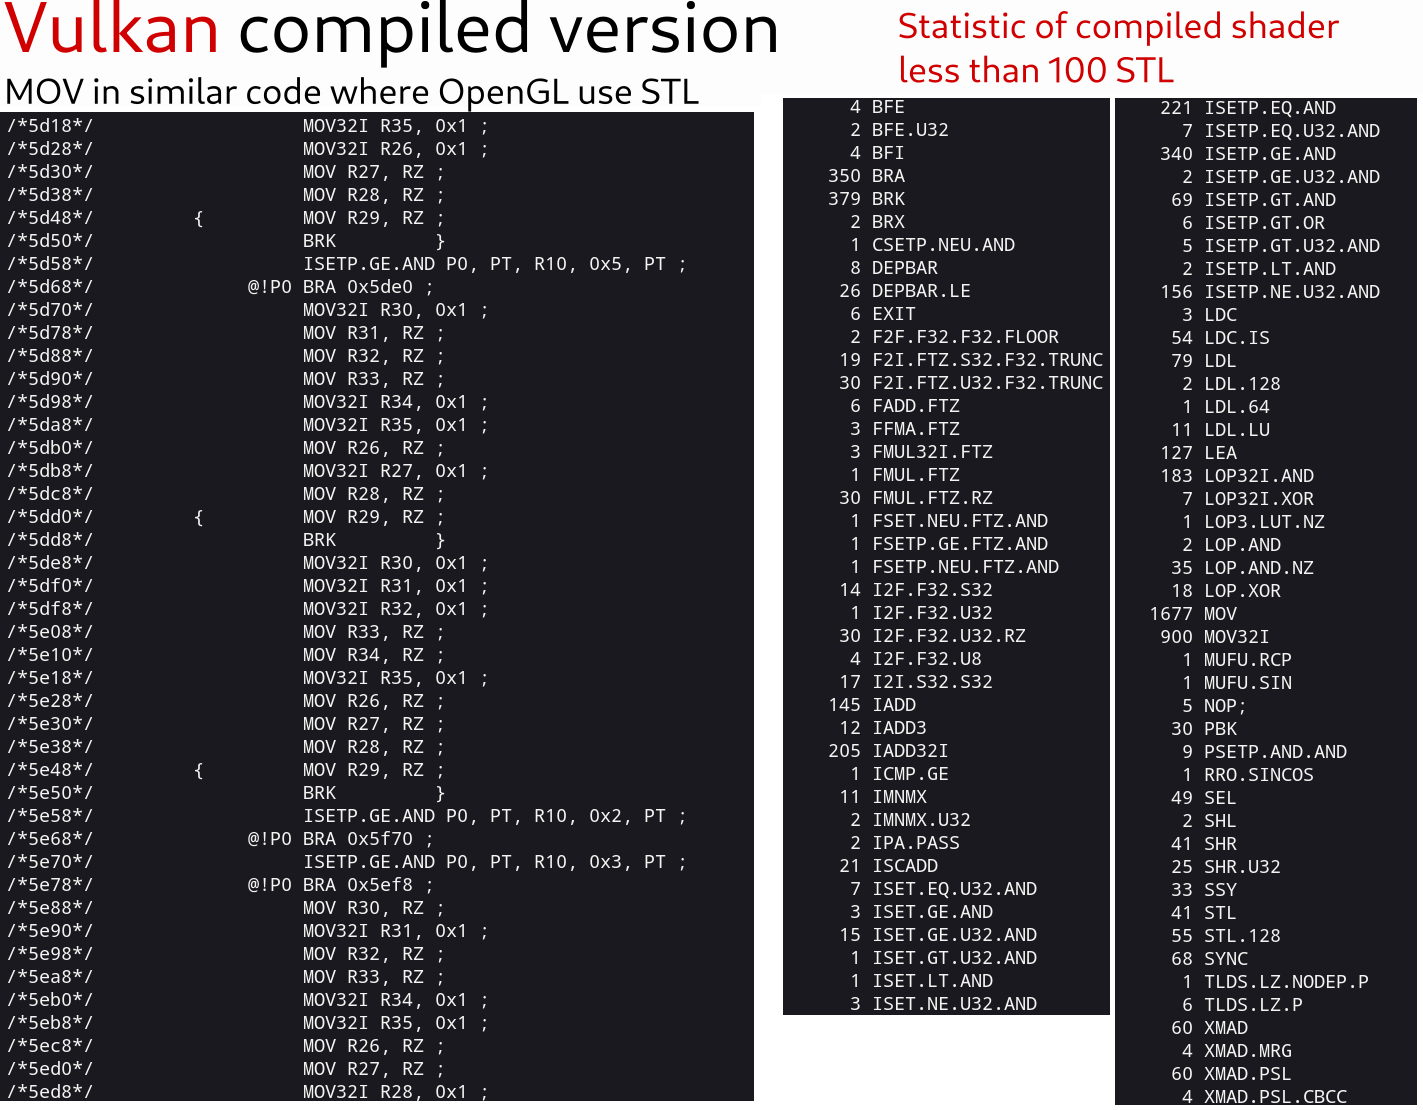
Vulkan statistic of same shader
OpenGL version use 3600+ STL instructions, but shader works same fast in OpenGL and Vulkan (very similar FPS, even on low-end Nvidia GPU).
In this case, STL does not have huge impact on performance. (I not 100% sure in this case, but STL do impact performance even in this large shader)
Optimization of this my GLSL Auto Tetris shader:
Main performance speedup is — switching from using int[220] array to uint[7] .
I use int[220] to store 220 bits, so seven uints is enough to store it.
Look Common on linked Shadertoy shader — line 11 #define use_uint_map
Uncomment this define to use new map.
I see about 5x speedup (in OpenGL) — if you set #define AI 0 in Common to test maximum shader load.
In Vulkan — I think about ~2 times faster from using smaller array.
Analyze and optimize neural(ML) shaders:
This shader — A coffee cup lightmap neural net works for me (on Nvidia) with 2–5 FPS in preview 800x450. (yes its because I use low-end Nvidia GPU, on AMD GPU or better Nvidia this shader works also fast)
When this other very similar by amount of data shader — Suzanne Neural Light Field works with 60 FPS even in 1080p fullscreen.
Let’s compare.
(I’m comparing only in Vulkan, it works with same FPS for me in Vk and OGL)
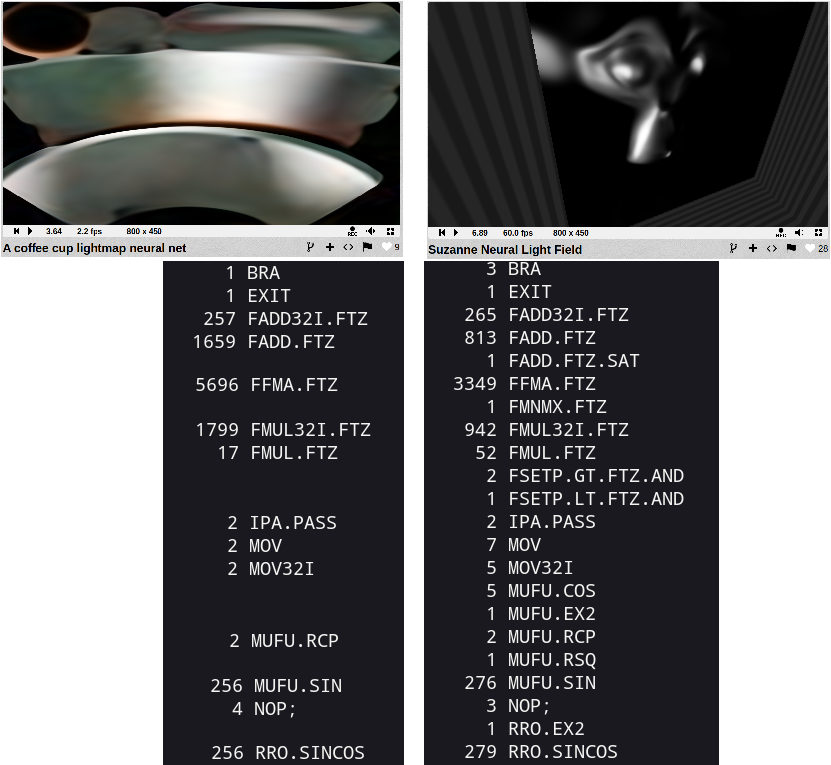
Statistic of instructions in each shader
From this I can assume:
- This is not because sin/cos instruction, same number of sin/cos in both shaders.
- Uses of FFMAFP32 — Fused Multiply and Add instructions about 2x more in first shader.
So this means — if I just “run the second shader twice” (Suzanne Neural Light Field shader) performance of shader will drop to 2–4FPS same as firs shader…
Let’s test:
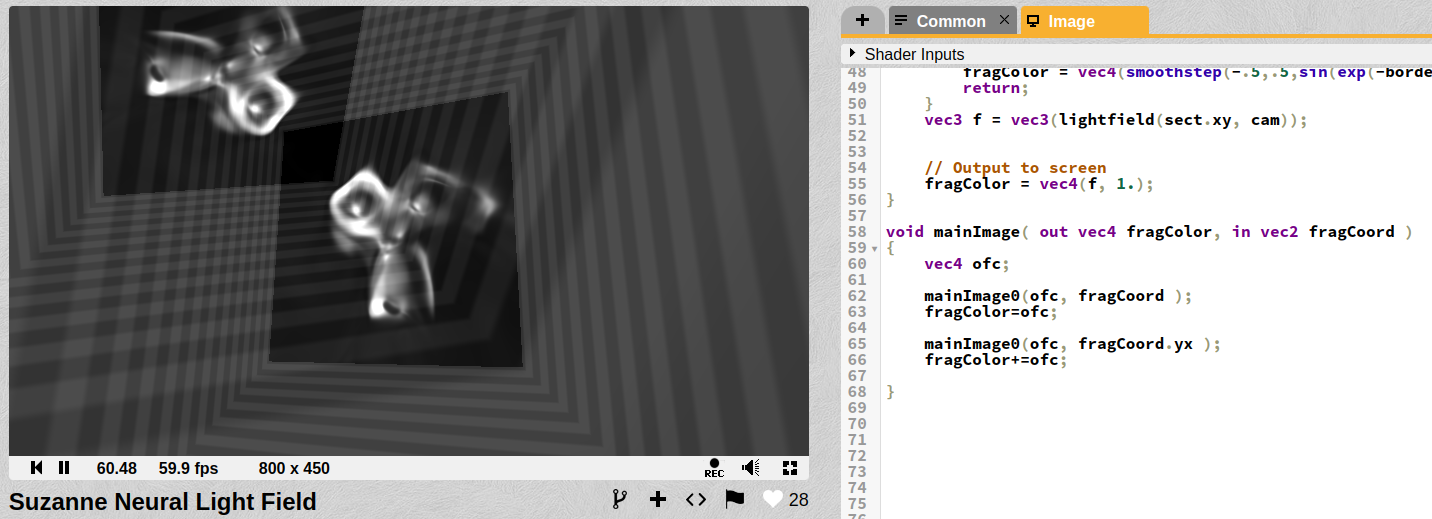
Rename original mainImage to mainImage0 and run it twice — I have two monkeys.
Still 60 FPS
Compiled code:

2x of everything
Almost everything multiplied by two, even sin/cos run twice, but performance does not drop at all.
Still 60 FPS, when first shader (A coffee cup lightmap neural net) has very slow performance 2–4 fps in preview with same number of instructions.
Only difference left between those two shaders — is the amount of internal data in those mat4 constants.
A coffee cup lightmap neural net — use 7x8x8 (this Jure Triglav blog explains some of it) is 448 of mat4 — 28 Kbyte of data. (actually stored 0x1ef4 bytes or 7 Kbyte)
Suzanne Neural Light Field — use 16x16 model that 256 mat4 constants in shader code or 16 Kbyte of data in constants. (actually stored 0x43c bytes or about 1 Kbyte)
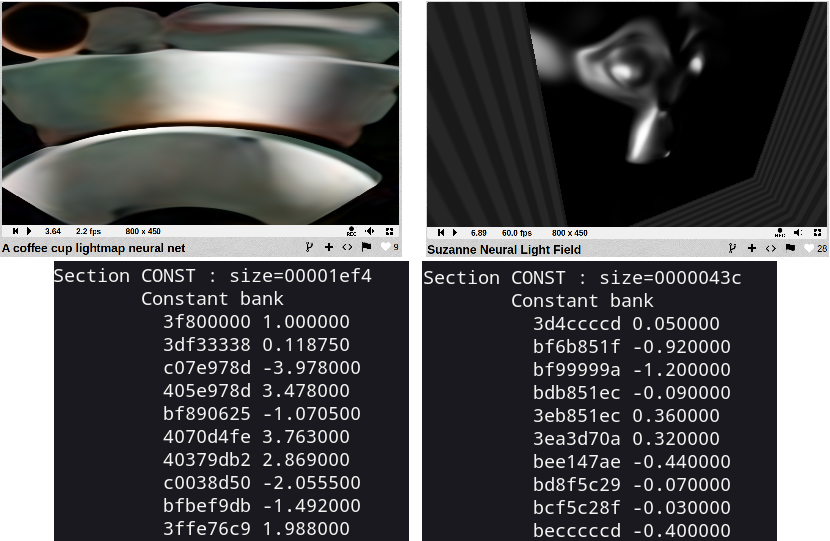
Section CONST in nvdisasm output
I think my GPU performance problem — is “too many constants”.
My conclusion out of all this — around One or Two Kbyte of CONST is limit for “good performance” for this my Nvidia GPU.
1 Kbyte is 256 unique float values.
My try to fix this:
I have an obvious and simple idea — convert each of “unique floats” to some limit range and then replace original value by “compressed”.
This simple python script cfloats.py used to process floats.
Result:
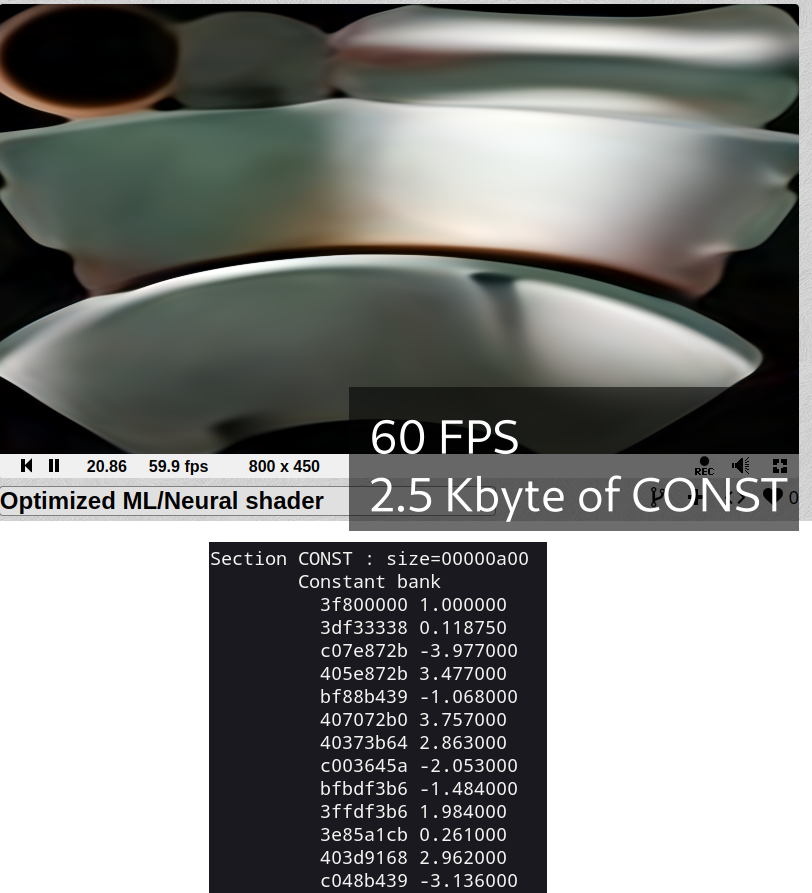
I got 60 FPS in 800x450 preview and 30 fps in fullscreen, from original 2–4 fps in preview and 0 on 1080p fullscreen.
Optimization — just replacing float constants in code to some other float, like 0.011 and 0.012 become single 0.011 to use less space in CONST memory.
Final optimized shader — Optimized ML/Neural shader.
For this shader I used b_scale = 132.0 in cfloats.py python script to scale floats.
I tested with smaller values, and bigger — with even 1/64 or 1/32 as float step performance almost same as with 120–150(b_scale). When b_scale is 180+ it drop to 30 fps on preview.
Look like when CONST size hit 3 Kbyte+ my Nvidia GPU gets much slower compare to 1–2 Kbyte of CONST.
Yes there are some quality loss:
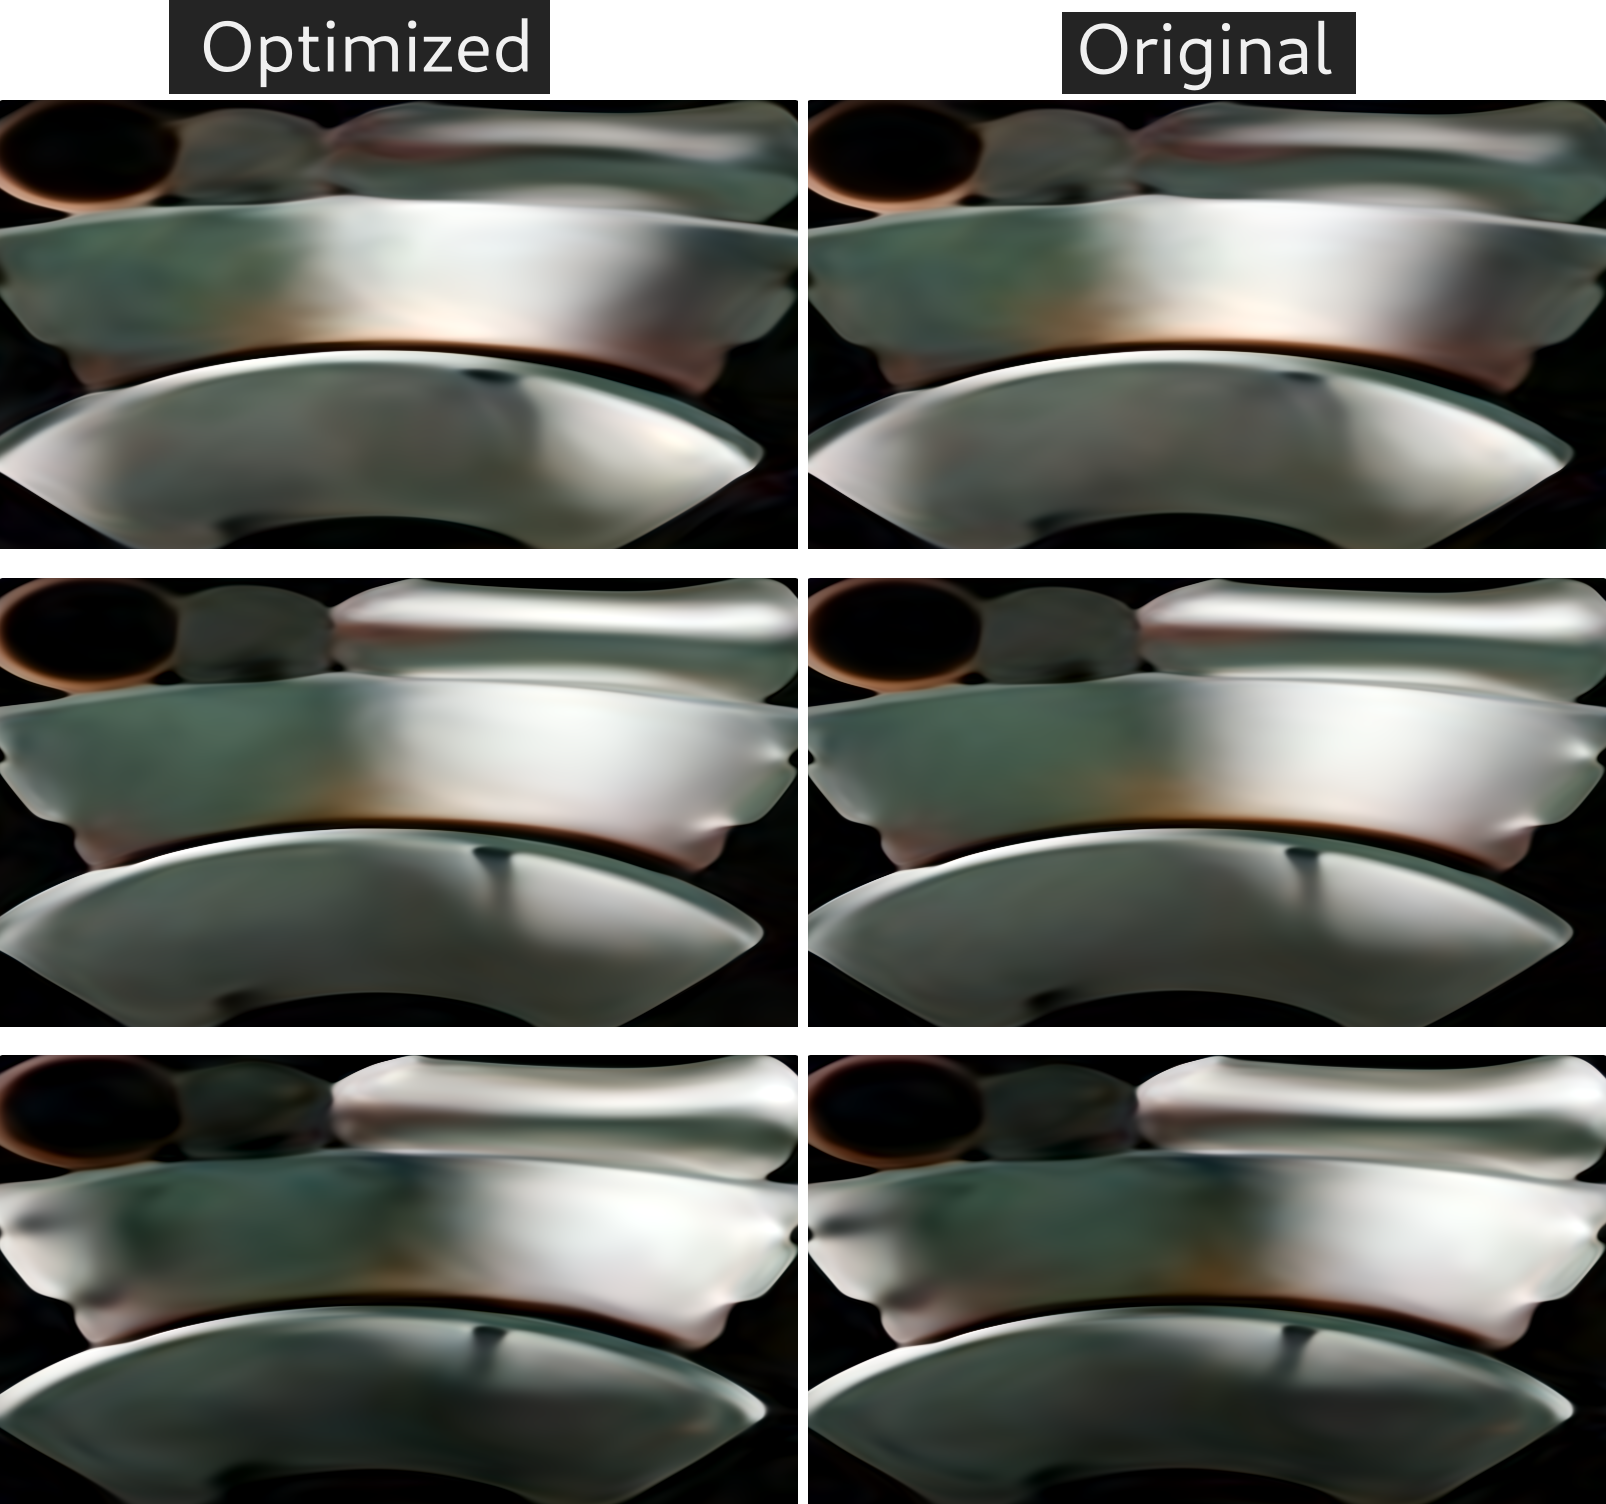
I think it can be used to optimize ML/Neural shaders for low-end hardware.
Like old GPUs that still support modern graphic API but they become way too slow to process modern amount of data.
Enjoy debugging xD